How to use Expo: build a dealer positioning map
Expo is not one number or one wall. It is a workspace for turning an options chain into a structured question: where positioning is concentrated, which expirations matter, and how price is behaving around the levels you are watching.
Start with one question, not a trade
The fastest way to make Expo noisy is to open every panel and search for a verdict. Start smaller. Pick a symbol, then state what you are trying to understand: the day's gamma regime, a nearby level, the influence of today's expiration, or whether volatility and time are changing the picture.
That question determines the first Greek, view, and expiration set. Gamma is a useful default when you want to orient around positioning and nearby levels. It is a starting point, not a signal to buy, sell, fade, or follow price.
A useful first pass
“For this symbol, what does the selected options book say about the area around spot, and which expiration is carrying that structure?”
Read the four views as one map
Expo gives the same selected book four different jobs. You do not need to master them all at once, but the handoff between them is what makes the workspace useful.
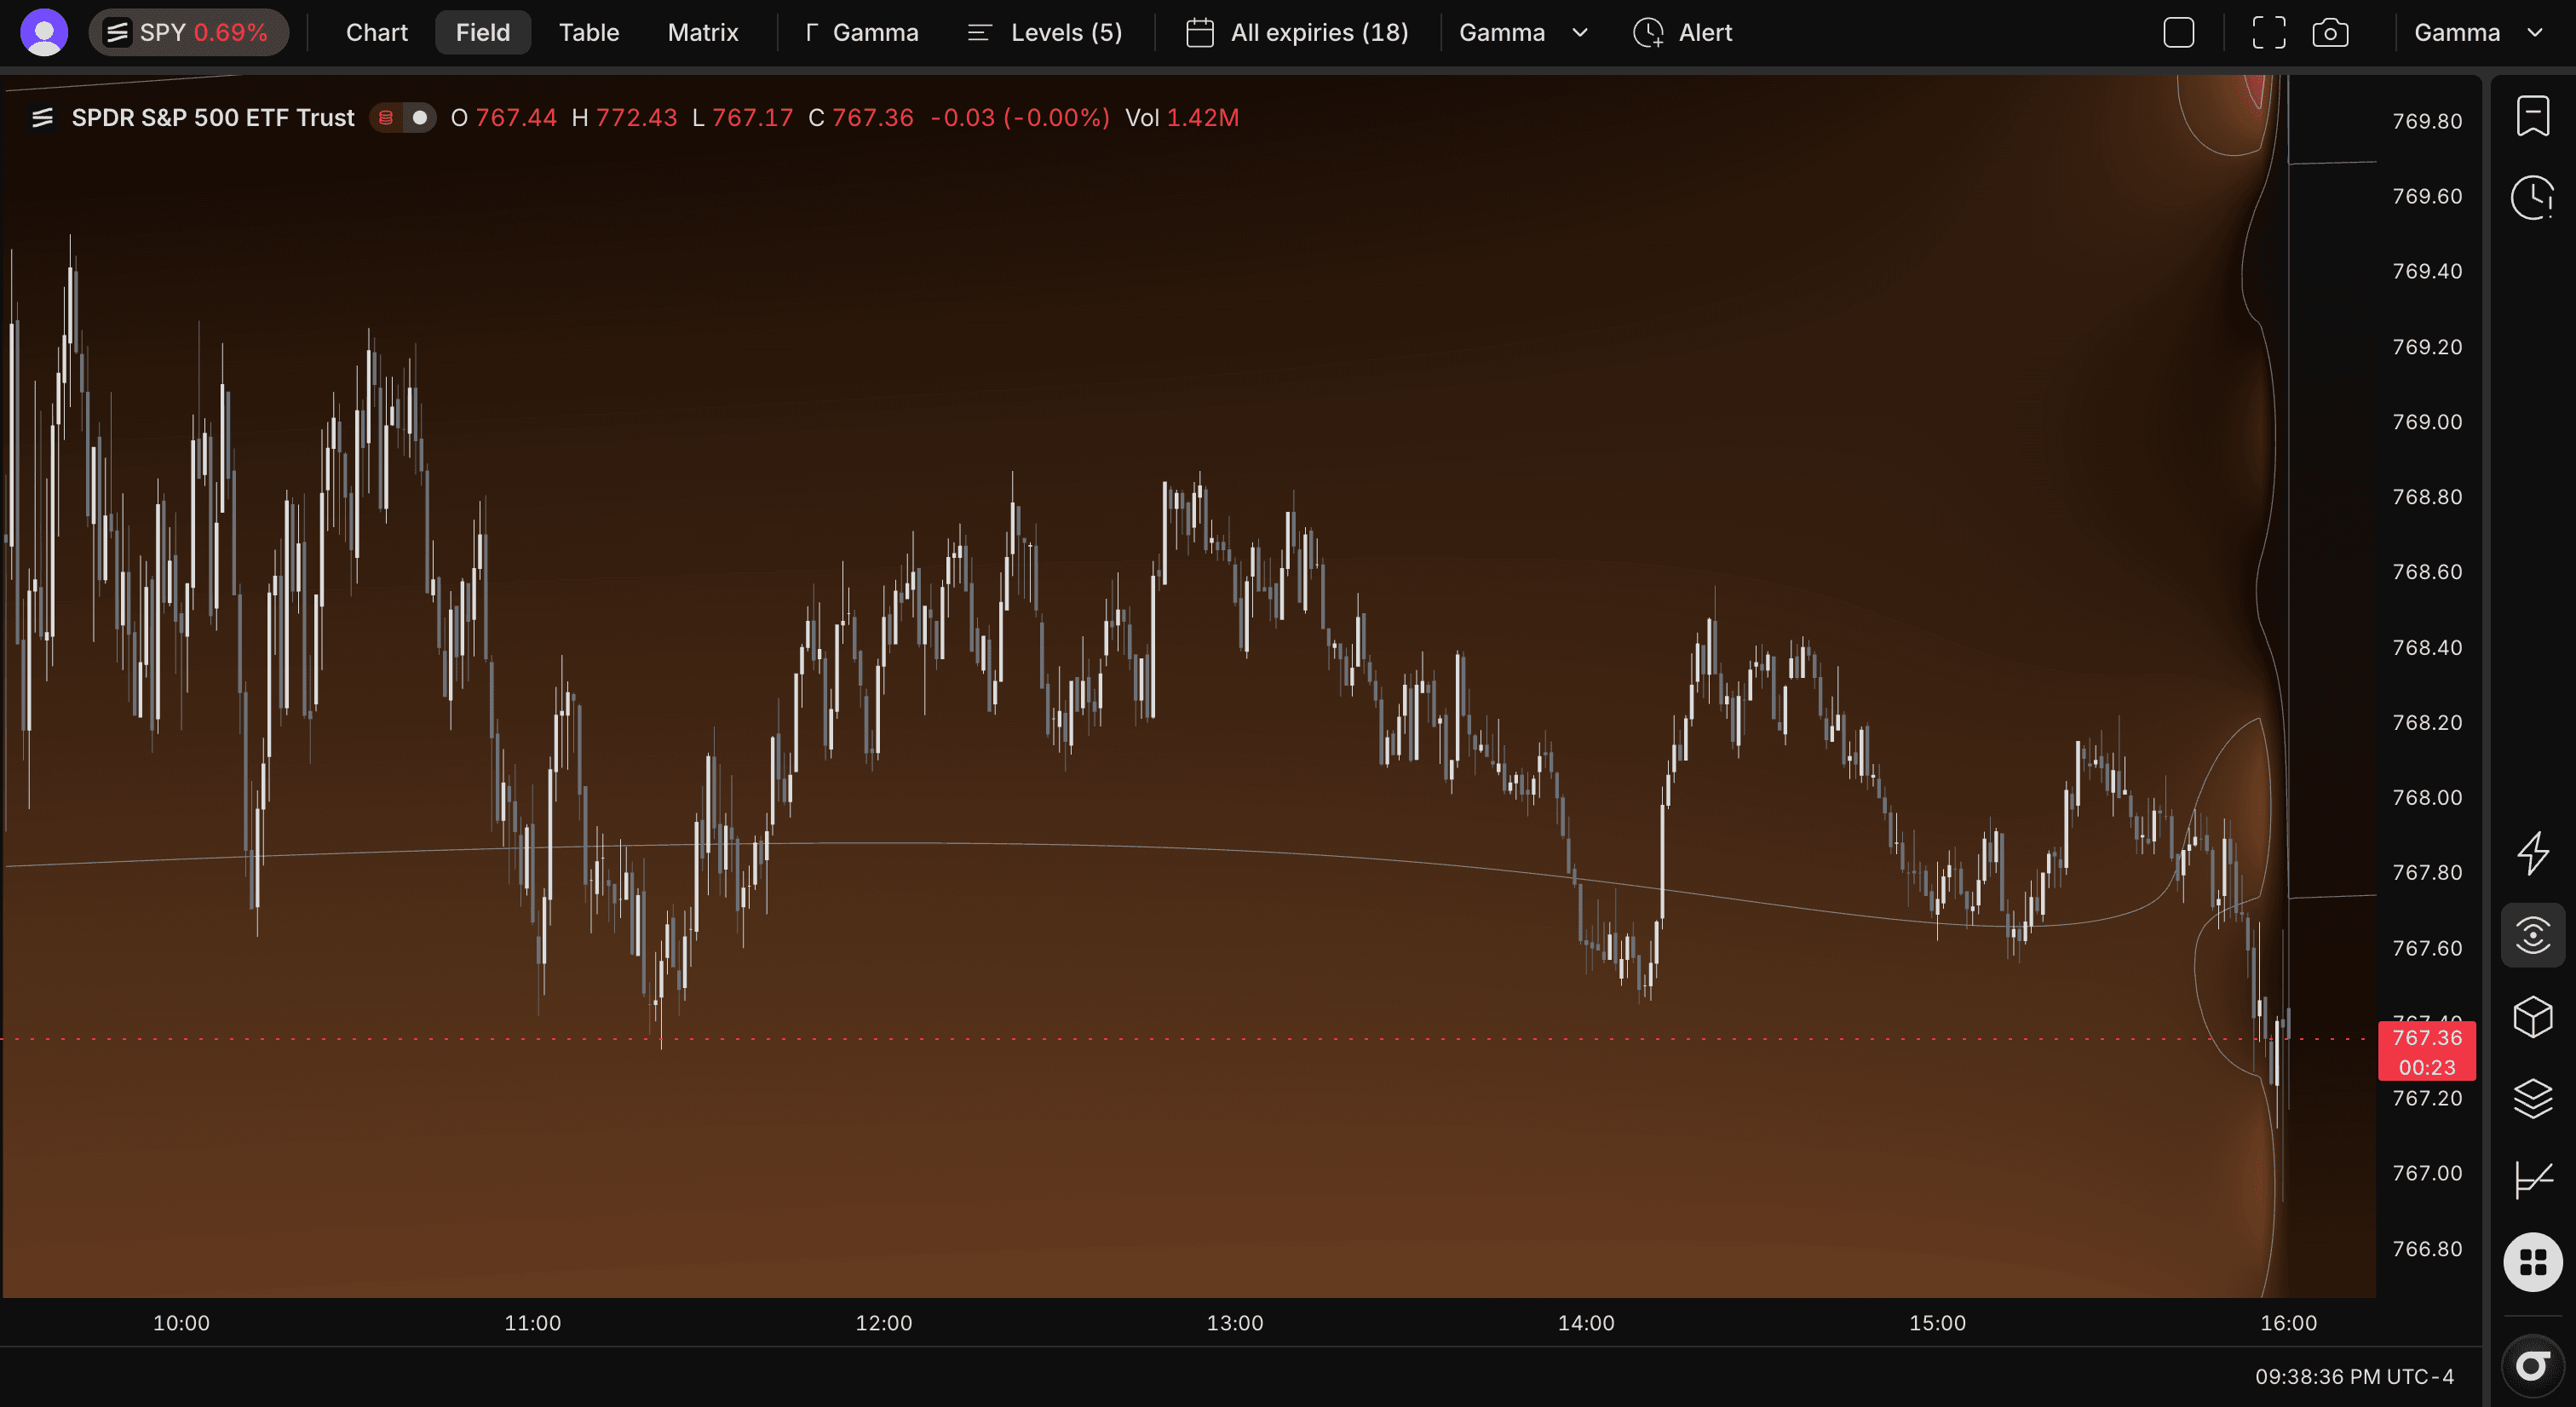
Field: see positioning through price and time
Field is a price-by-time surface. It helps you see where the selected Greek is concentrated as the session progresses. The vertical axis is price, not a strike ladder. Use it to orient around the shape of the selected book and the location of spot inside that shape.
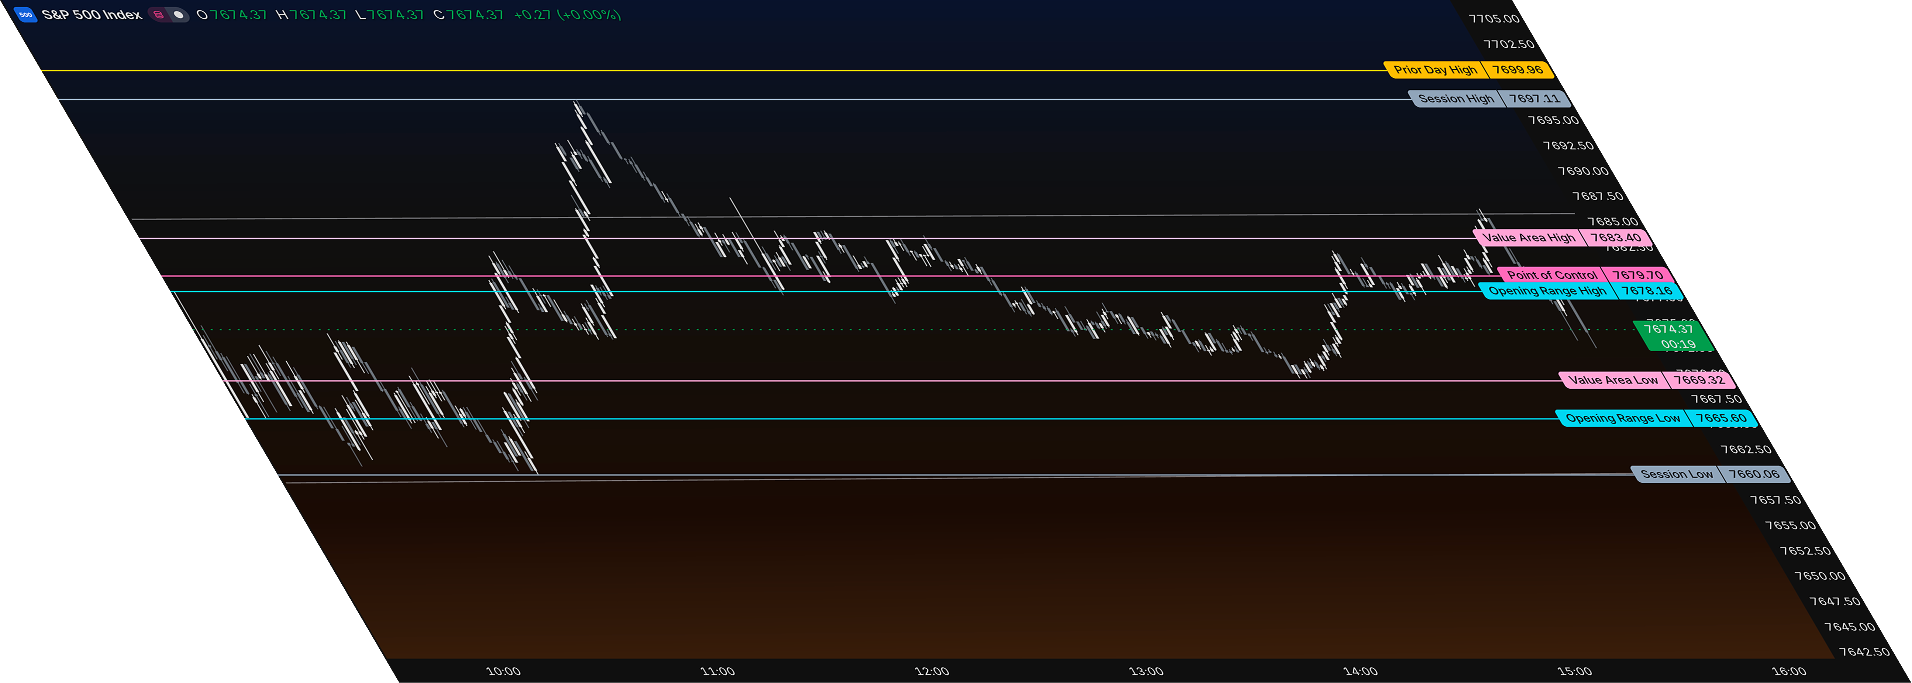
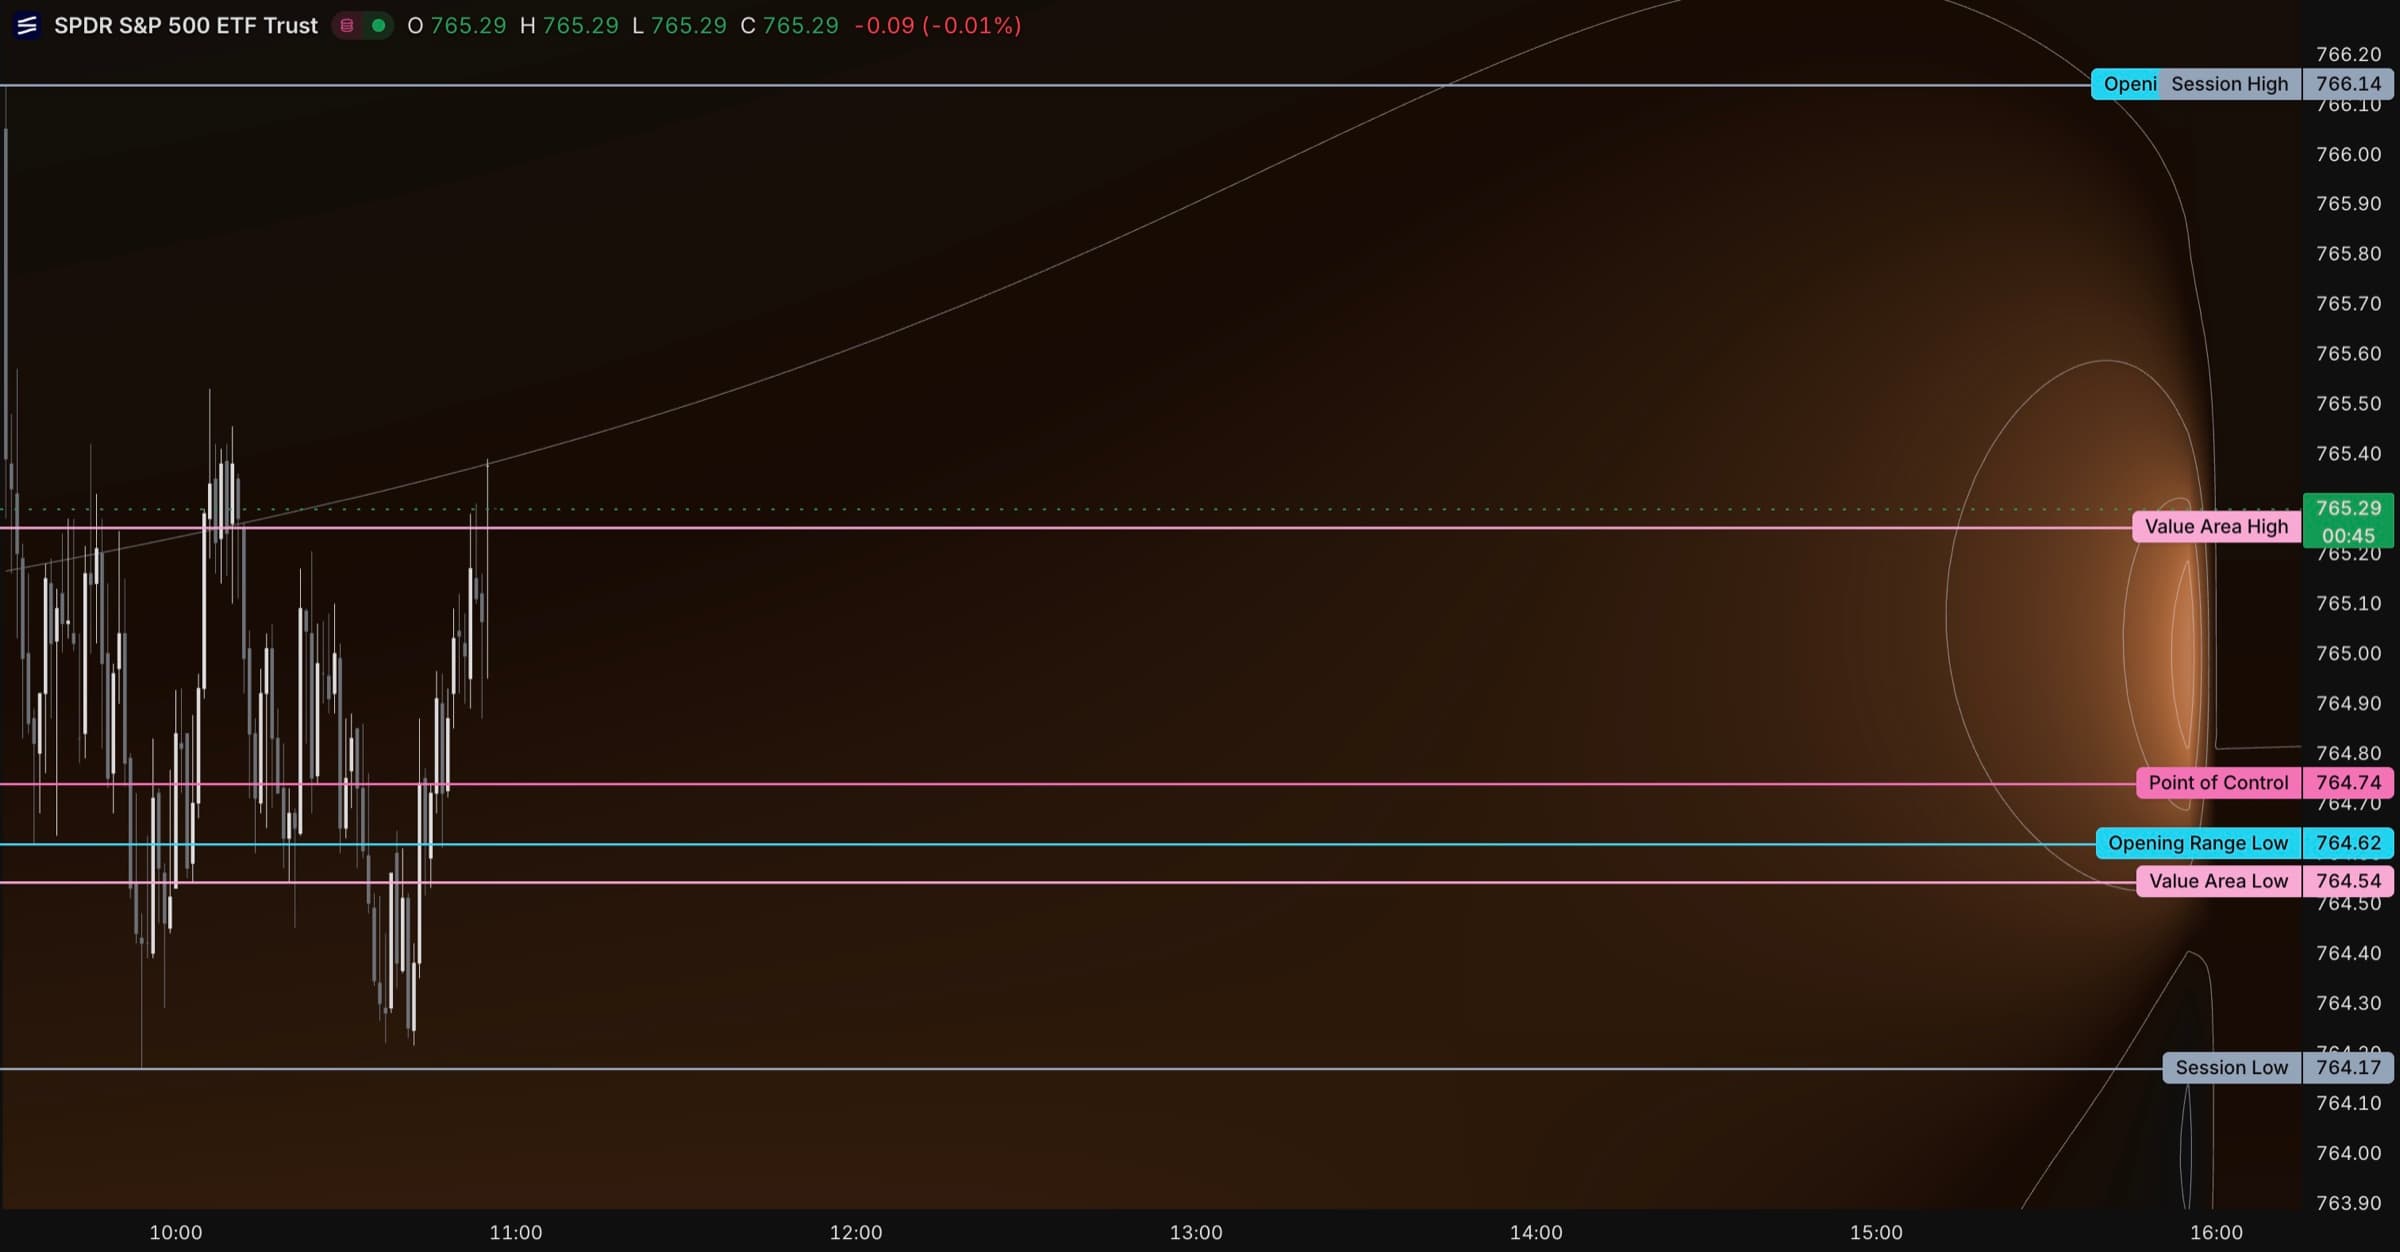
Chart: put the levels against price action
Chart puts candles and selected levels in the same frame. This is where you check how price has approached, tested, or moved away from a level. It supplies context for a level; it does not turn that level into an execution instruction.
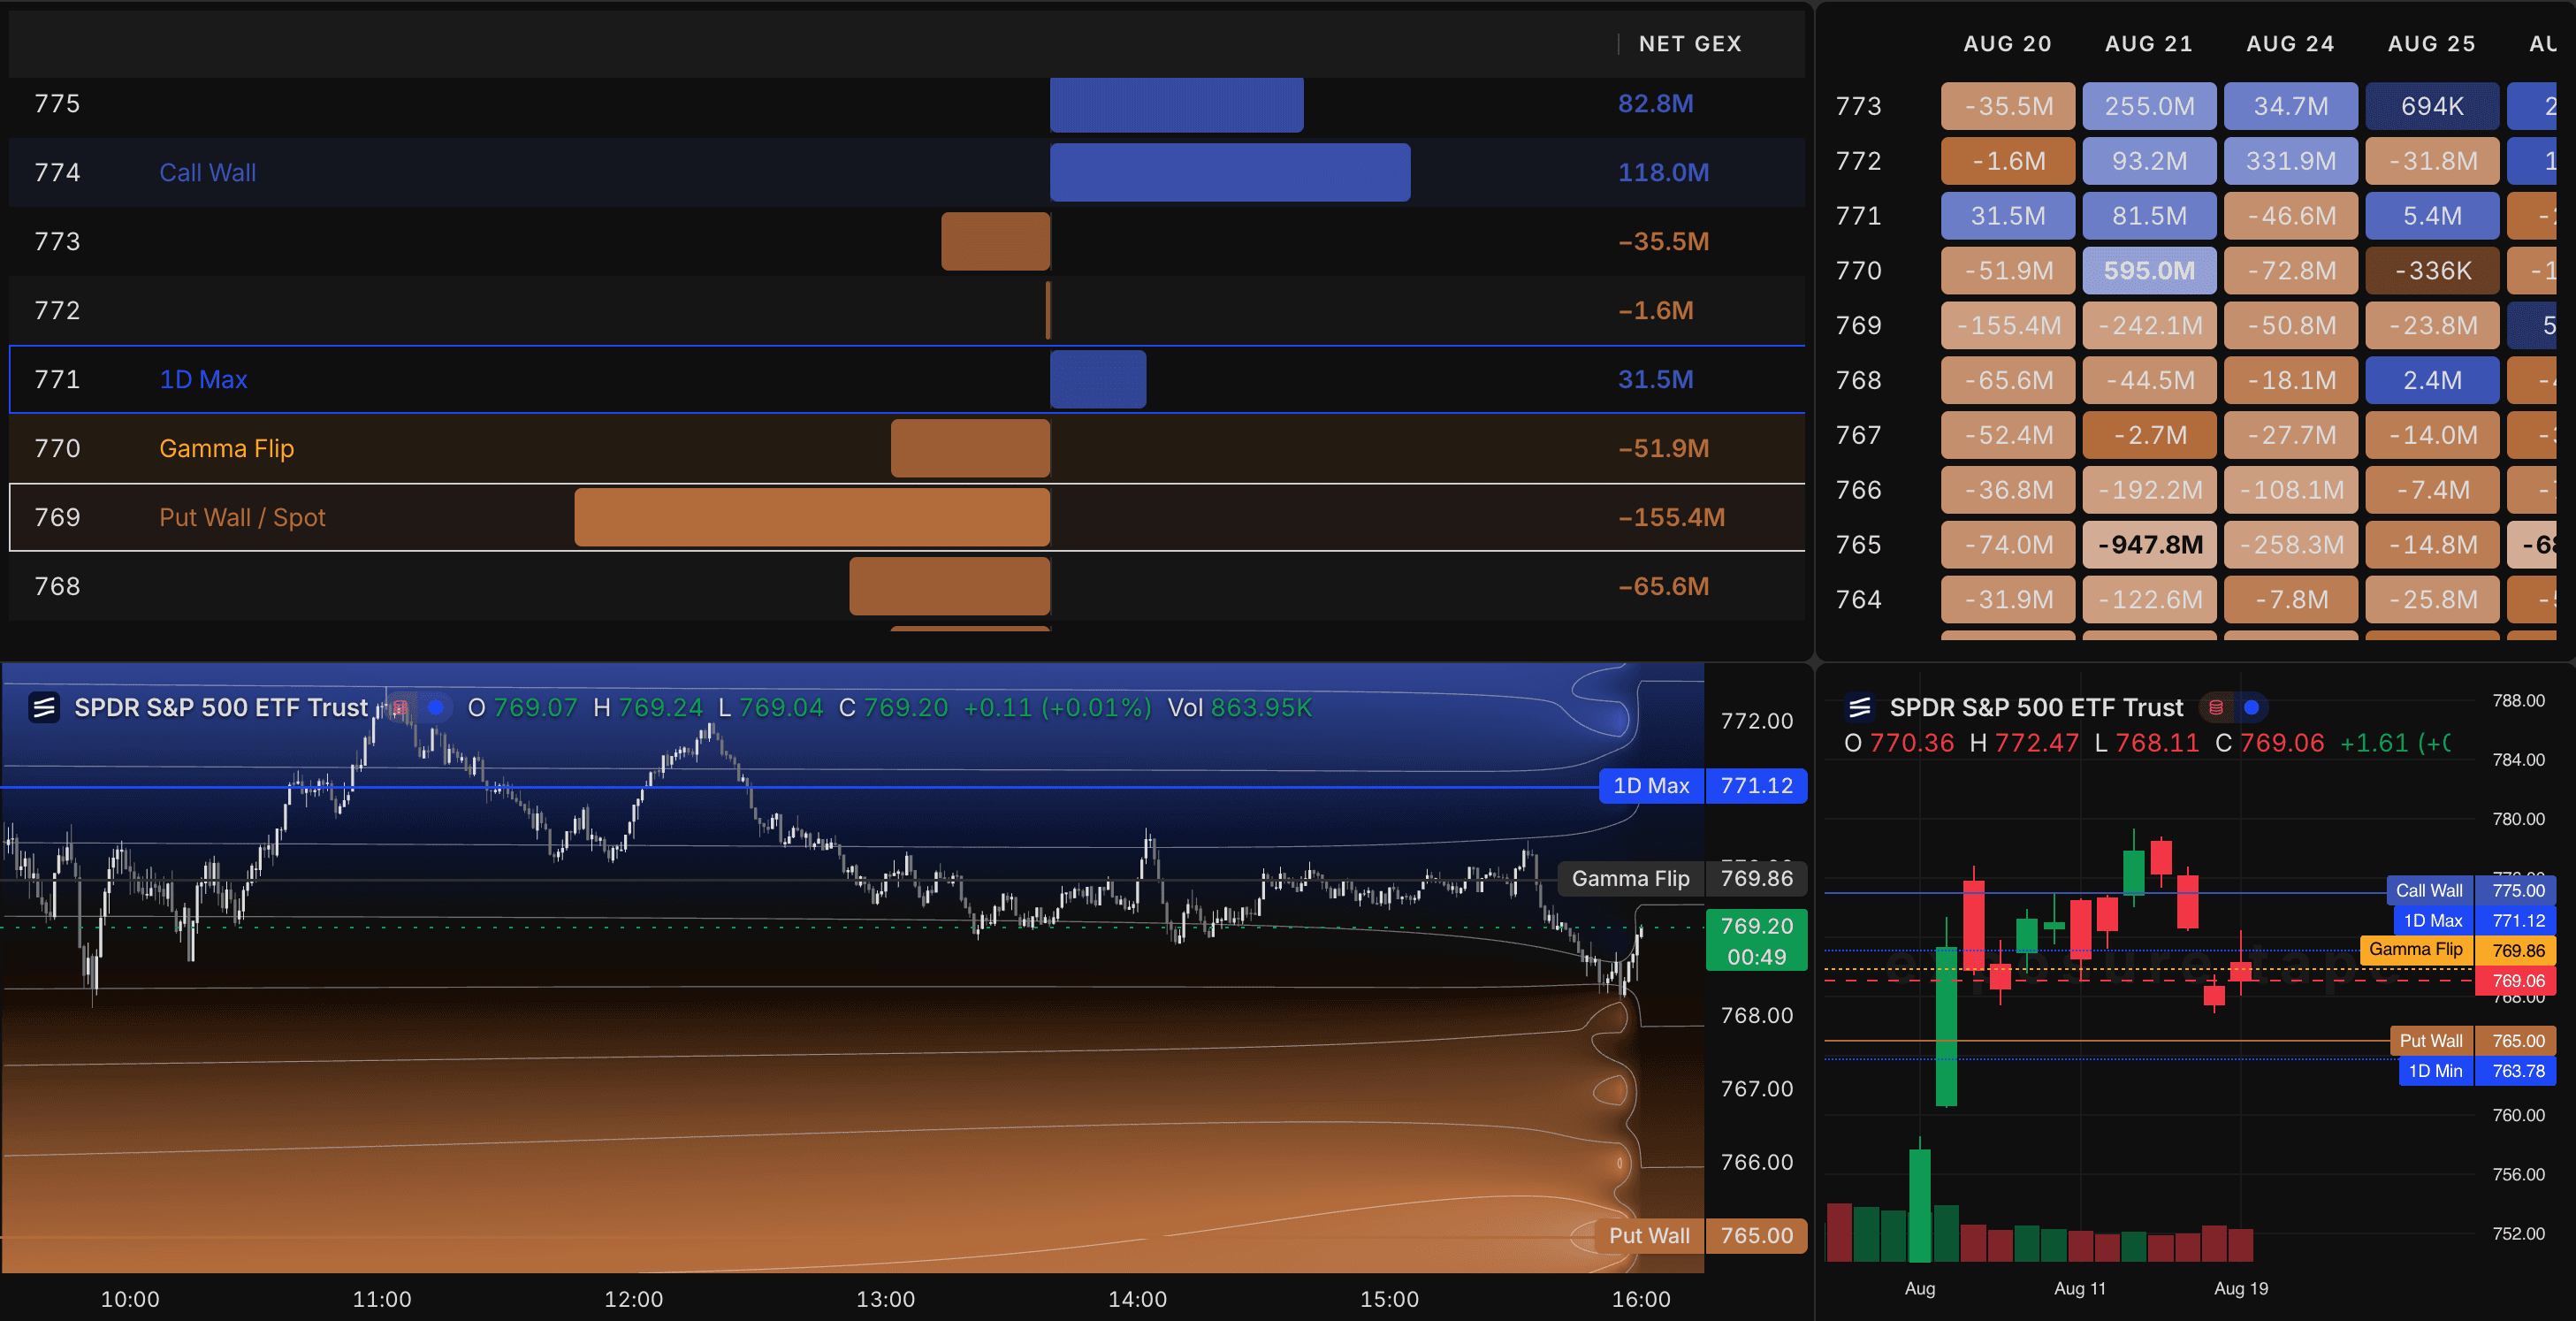
Table and Matrix: explain the structure
Table is the strike-by-strike inspection view. Matrix is the strike-by-expiration view. When a level looks important in Field or Chart, use these views to see whether it comes from one expiration, a cluster of expirations, or a broader part of the chain.
Build the map in a repeatable order
The workflow below is deliberately simple. Repeat it for the same symbol and selected expirations rather than continuously changing inputs until the screen tells a more satisfying story.
1. Set the symbol and begin with Gamma.
Start with all active expirations only when you need the broadest structural read. Otherwise begin with the expiry context that matches the question you set.
2. Mark the relationship between spot and the visible levels.
Look for the Gamma Flip, call wall, put wall, and expected move only if those overlays serve the question. Their value is the relationship to price and one another, not the fact that a colored label exists on the chart.
3. Check the same area in Table or Matrix.
Confirm whether the concentration is broad or isolated. A level supported by multiple expirations tells a different structural story from a level created almost entirely by a same-day expiry.
4. Return to Chart for price context.
Note the actual price behavior at the level. Expo maps standing options positioning; Chart is where that map meets the market's behavior.
Choose expiration context before interpreting a level
A level does not mean the same thing when it is concentrated in 0DTE contracts as when it persists across several future expirations. This is why Matrix matters: it separates a near-dated concentration from structure distributed across the expiration ladder.
Expo's expiration selection is cumulative. Selecting an expiration includes that date and each earlier active expiration in the selection. “All expirations” is therefore a sum of the active snapshot, while a near-date choice helps isolate the short-dated layer of the book.
There is no universally correct expiration setting. Use the shortest relevant layer to understand today's immediate context, then widen the selection to test whether the structure holds up beyond it.
Switch Greeks deliberately
The Greek selector changes the question being asked. Keep the same symbol and expiration context when switching, so you can compare interpretations rather than compare unrelated screens.
| Greek | Use it to ask | Best follow-up view |
|---|---|---|
| Gamma | Where does positioning shape the near-price regime and its key levels? | Chart, then Matrix |
| Delta | How is directional exposure distributed around the selected book? | Field or Table |
| Charm | How could time decay change delta exposure as expiration approaches? | Field, Table, or Matrix |
| Vanna | How sensitive is the selected positioning to a change in implied volatility? | Field, then Matrix |
Charm does not render in Chart. Expo moves that selection to a supported view so you do not mistake an unavailable visualization for an empty reading.
Keep the limits in view
Expo is a map of modelled dealer positioning built from the selected options-chain snapshot. It is not a record of every live transaction, an order book, or a forecast of what price must do next. Its best use is to structure attention and make a price move easier to investigate, not to outsource a decision.
- Open interest is a standing-position input and does not update like live trade flow during the session.
- Dealer positioning is inferred from the book and sign conventions; it is not observed dealer inventory.
- Field uses a modelled implied-volatility surface, so its shape is most useful as context rather than false precision, especially far from spot.
- Thin or unusual options chains can produce levels that deserve more skepticism, not more confidence.