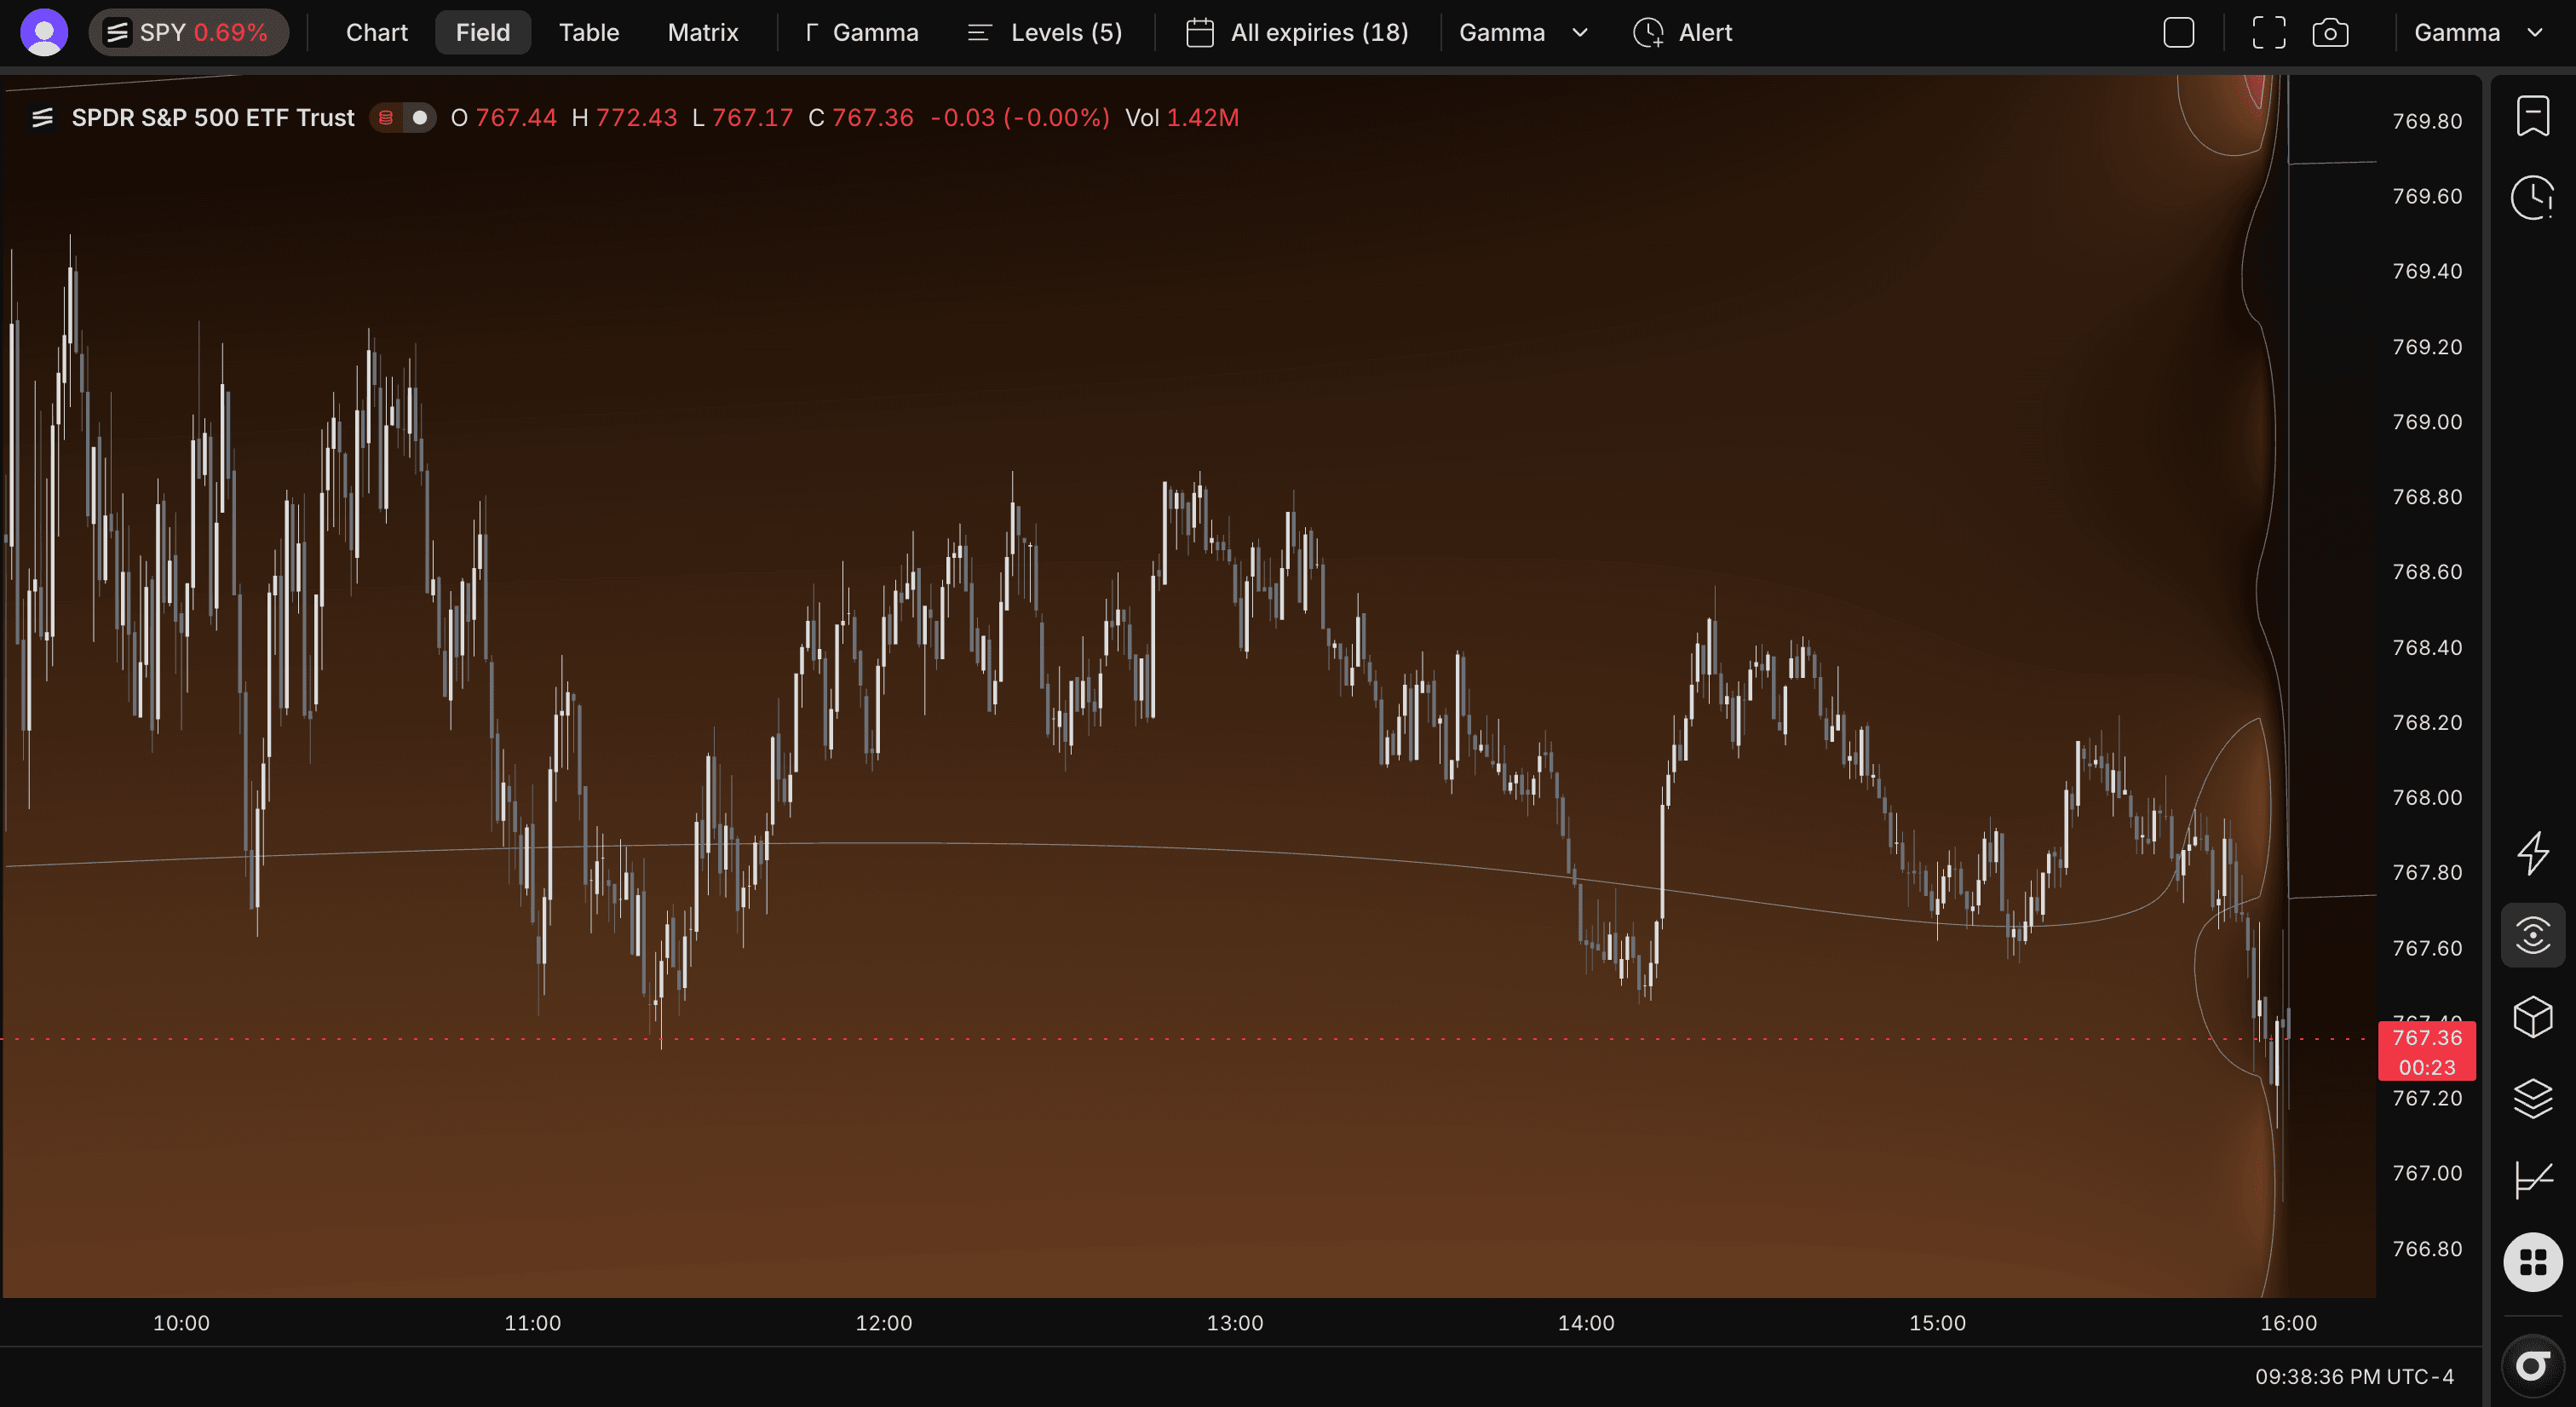
What is Expo? The positioning map beneath price
Price does not move through an empty chart. It moves through an options book whose risk changes with price, time, implied volatility, and expiration. Expo turns that changing structure into a map, so the question becomes what positioning surrounds price—not what a single indicator says.
A market moves through a positioning map
Every option in the selected chain carries directional risk. As spot, time, or implied volatility changes, the hedge required against that risk can change too. Expo models that standing structure from the chain and gathers it around one symbol, so the options book becomes part of the context beside price.
It is not a live order book, a record of every transaction, or a window into a dealer's actual inventory. It is a structured model of the positioning implied by the selected options snapshot. That distinction is what makes it useful without pretending it knows the next candle.
More than a gamma chart
Gamma is often the starting point because it shows where hedging may counter or reinforce a move around the current price. But a session is not only a gamma story. Delta describes the directional exposure in the selected book. Charm shows how the passage of time can change that exposure as contracts approach expiry. Vanna shows how a change in implied volatility can alter it.
Expo keeps these lenses together because they describe the same landscape from different angles. One day may be shaped by nearby gamma concentration; another may be more about time decay into an expiration or a repricing of implied volatility. The aim is not to hunt for a favorite Greek. It is to see which part of the book is relevant to the question in front of you.
A level gets its meaning from the regime
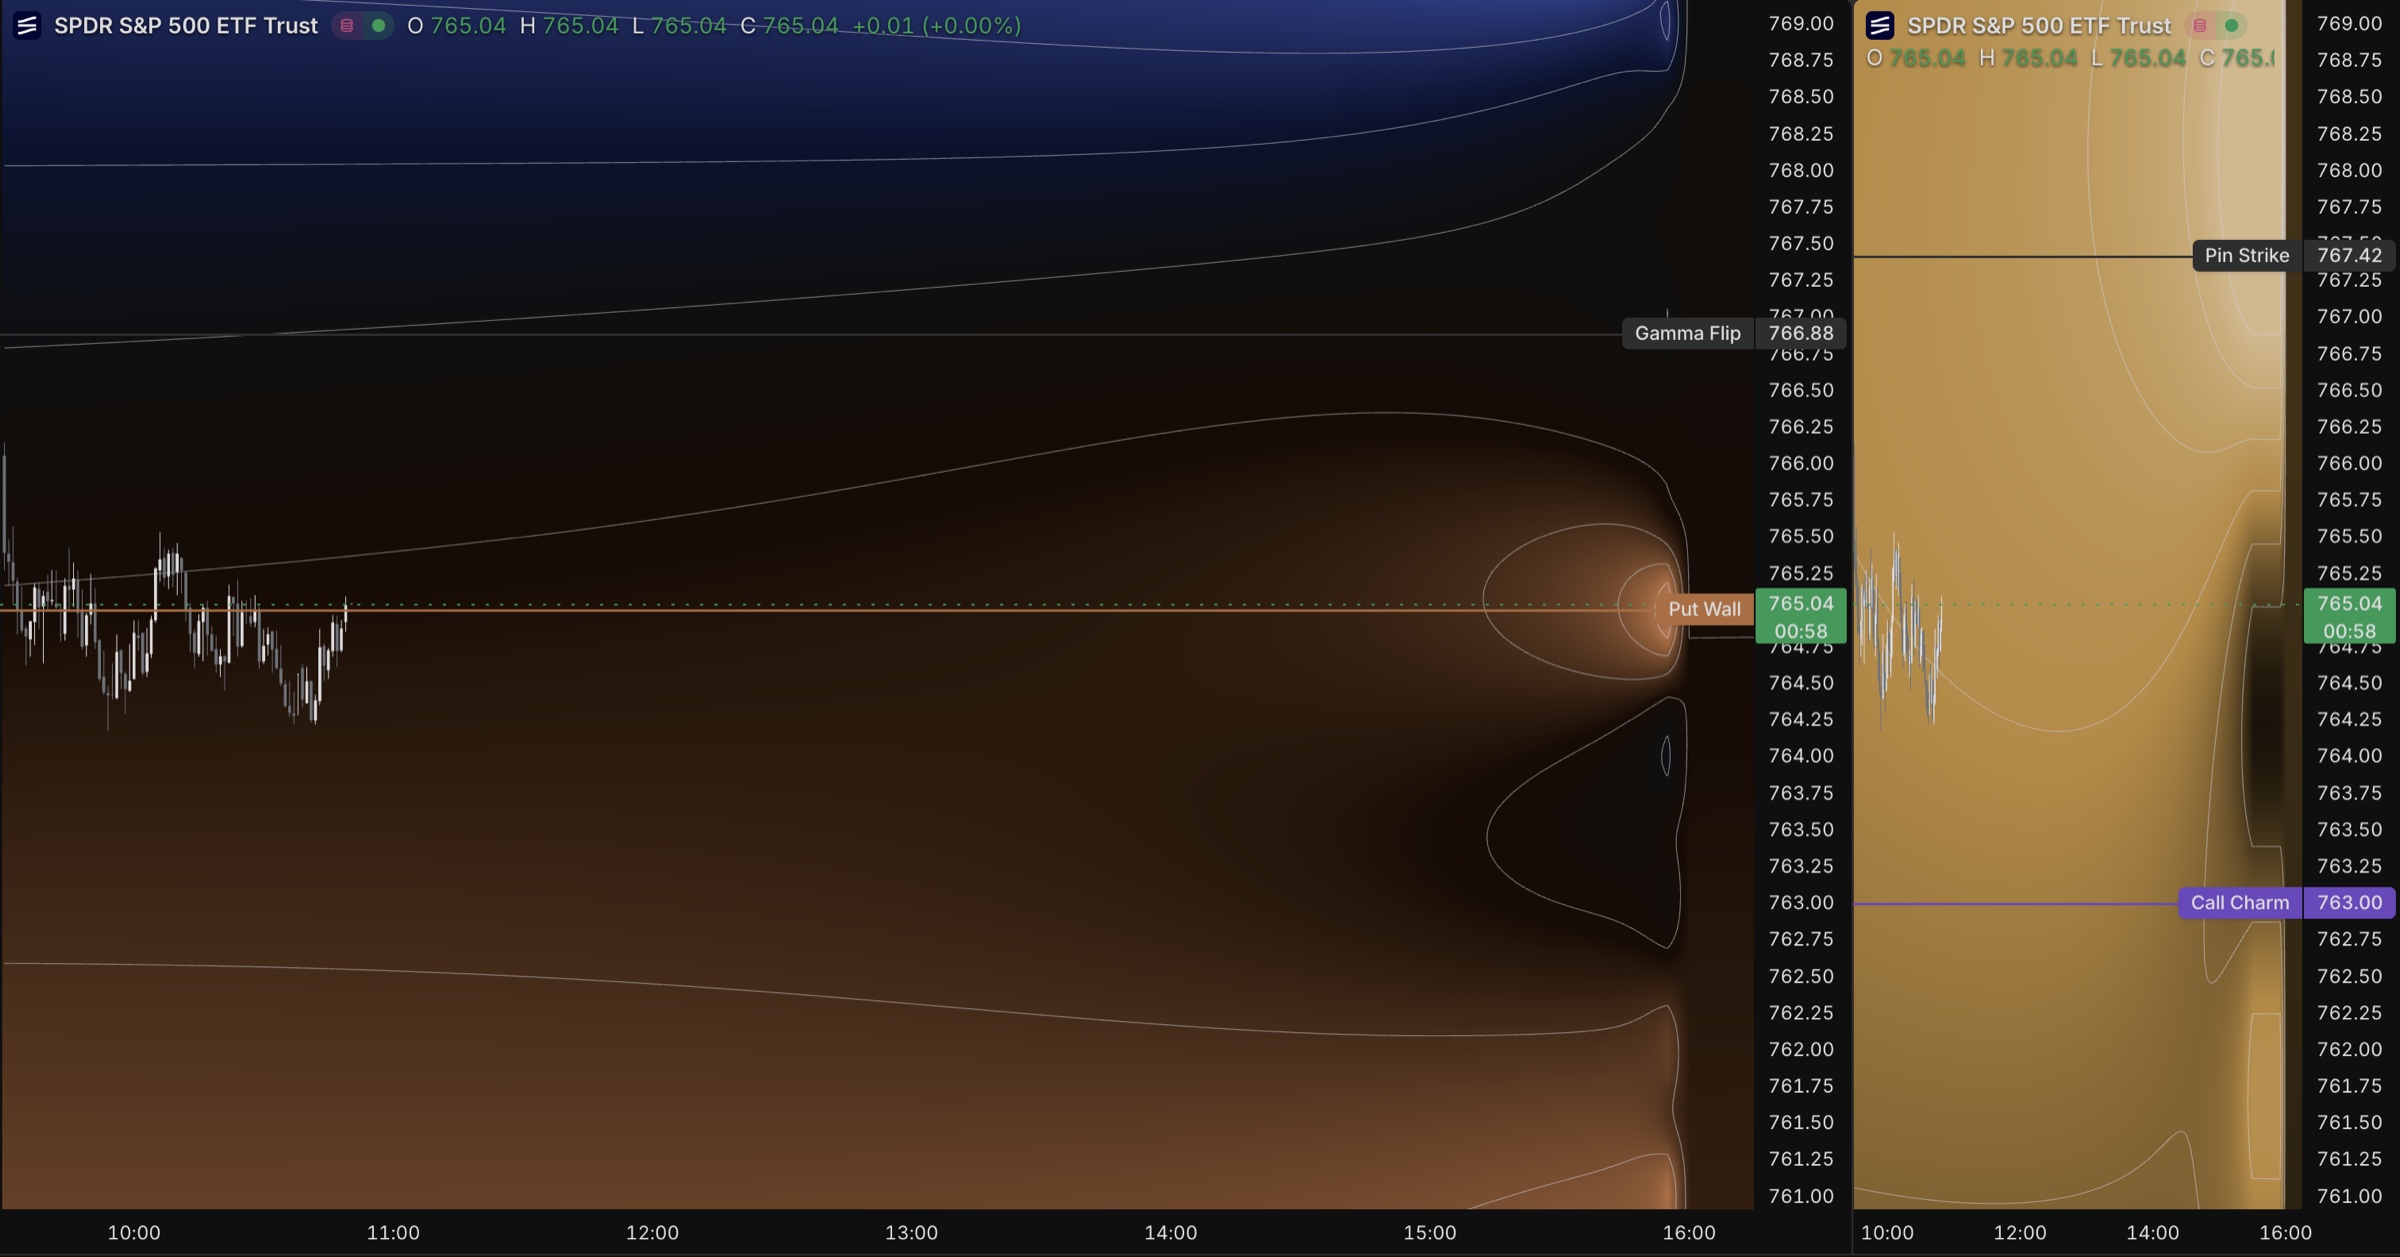
That is why a level is never enough on its own. A call wall, a put wall, a gamma flip, or an expected-move boundary is a location inside a larger positioning regime. The useful question is how spot sits relative to that location, the concentration around it, and the expirations creating it.
Expo gives that relationship a frame. It helps distinguish a level that deserves attention from one that is isolated or belongs almost entirely to a short-dated part of the chain. Price still supplies the confirmation; the map simply makes the behavior easier to investigate.
The clock changes the picture
Time is part of the terrain. Near-dated contracts, especially 0DTE contracts, can change the shape of the selected book much faster than later expirations. The same area around spot can mean something different in the morning, late afternoon, or on an expiry day.
Choosing an expiration context is therefore not a settings detail. It is a decision about which part of the options book you want the map to describe. Expo keeps that context visible while you ask whether today's structure is local, short-dated, or spread across the expiration ladder.
A map, not a command
Expo is best used before a conclusion, not in place of one. Its levels and surfaces are built from options-chain inputs, open interest, and modelled Greeks. Dealer positioning is inferred, not observed, and a level is not an instruction to buy, sell, fade, or follow.
What Expo can do is make the options structure behind a move legible. Instead of seeing price as a line with unexplained reactions, you can see the positioning, time, and volatility context that may be worth watching.